Local Management
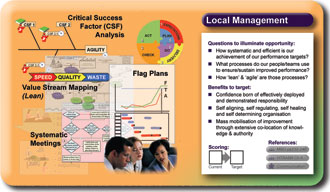
![]() Local (or Process) Management is the engine that
drives progress out of the insights, relationships and creative
opportunities generated within the logic of the QFD. Local Management
translates the targets and expectations of their process (generated
in the process proposal)
into current performance deficiencies, and then develops practical
plans to analyse and address those deficiencies systematically.
The result is learning, transformation, growth and inexrable
progress toward the goals. (For more on this perspective, see
Predict. See also the PowerPoint
slide sets on Process Ownership
and Process Management
(692 & 158 KB)).
Local (or Process) Management is the engine that
drives progress out of the insights, relationships and creative
opportunities generated within the logic of the QFD. Local Management
translates the targets and expectations of their process (generated
in the process proposal)
into current performance deficiencies, and then develops practical
plans to analyse and address those deficiencies systematically.
The result is learning, transformation, growth and inexrable
progress toward the goals. (For more on this perspective, see
Predict. See also the PowerPoint
slide sets on Process Ownership
and Process Management
(692 & 158 KB)).
![]() The website includes a number of tools
& concepts which support local management - covering
aspects of measurement, modelling, learning and problem solving
(some of which are covered under the Driving Improvement panel).
These tools tend to support the detail of understanding and taking
action.
The website includes a number of tools
& concepts which support local management - covering
aspects of measurement, modelling, learning and problem solving
(some of which are covered under the Driving Improvement panel).
These tools tend to support the detail of understanding and taking
action.
![]() The tools illustrated on the Local Management panel,
however, generally sit above these, providing a more strategic
level of insight and coordination over process improvement. They
are explained in more detail below:
The tools illustrated on the Local Management panel,
however, generally sit above these, providing a more strategic
level of insight and coordination over process improvement. They
are explained in more detail below:
|
|
|
|
|
|
|
|
|
|
|
|
![]() Further materials to help understand how Local
Management can work, and more specifically, how it can effectively
report its progress and performance, can be found here.
Further materials to help understand how Local
Management can work, and more specifically, how it can effectively
report its progress and performance, can be found here.
![]() Pages 232-246 of Managing
by Design can be found in Chapter
14 which can be read as a pdf file (137 KB) by clicking the
link above.
Pages 232-246 of Managing
by Design can be found in Chapter
14 which can be read as a pdf file (137 KB) by clicking the
link above.
![]() Chapter 6 of How To Build
A Better Business can be read as a pdf file by clicking here.
Chapter 6 of How To Build
A Better Business can be read as a pdf file by clicking here.
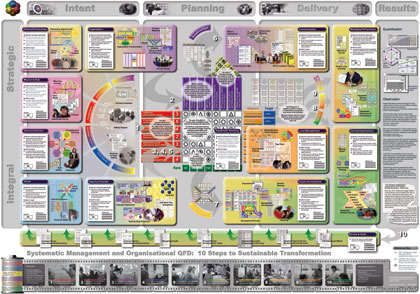
![]() Blank templates of this panel can be found in the
Big Picture Storyboard
file - these can be used to capture your own experiences and
progress in this area (by annotating them either in PowerPoint,
or as a printed panel), and then to physically cut and paste
them onto the Big Picture to create your own storyboard of implementing
systematic management in your organisation.
Blank templates of this panel can be found in the
Big Picture Storyboard
file - these can be used to capture your own experiences and
progress in this area (by annotating them either in PowerPoint,
or as a printed panel), and then to physically cut and paste
them onto the Big Picture to create your own storyboard of implementing
systematic management in your organisation.
To explore another secion of the big picture, please click on the relevant area of the image below:
© Tesseract Management Systems Ltd 2006
(click below for an oversight)
Get your own Big Picture
(Purchase the Big Picture as a high quality wall chart)
The best systematic resources now available.
(tools and methodologies)
Testimonials on systematic management
|
|
|
|
|
|
|
|
|
|
|
|
|
|
|
|
|
|
|
|
|
|
|
|
|
|
|
|
|
|