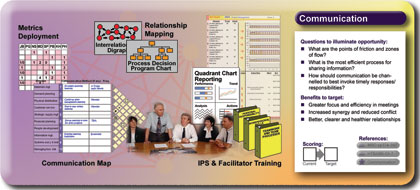
Communication
 Communication is one of the biggest problems facing
organisations today. Some would say it is because the word 'communication'
is actually a nominalisation (turning a verb into a noun) which
simply obscures its intent and scope - and that we would be much
better off if we were clear about who is communicating what to
whom, rather than some more general and nebulous concept. We
would agree with this principle, and 80% of the tools reflected
on the Communication panel are simply about gaining clarity of
focus over 'what' needs to be communicated, by 'whom' to 'whom'.
Our focus in this panel however is quite specific - we are limiting
ourselves to the relationships between processes, and between
processes and the top-level, to ensure that progress against
the intent of the organisation is swift, efficient and that any
issues are effectively and promptly addressed - all the while
maintaining a real sense of ownership at the process level. Communication is one of the biggest problems facing
organisations today. Some would say it is because the word 'communication'
is actually a nominalisation (turning a verb into a noun) which
simply obscures its intent and scope - and that we would be much
better off if we were clear about who is communicating what to
whom, rather than some more general and nebulous concept. We
would agree with this principle, and 80% of the tools reflected
on the Communication panel are simply about gaining clarity of
focus over 'what' needs to be communicated, by 'whom' to 'whom'.
Our focus in this panel however is quite specific - we are limiting
ourselves to the relationships between processes, and between
processes and the top-level, to ensure that progress against
the intent of the organisation is swift, efficient and that any
issues are effectively and promptly addressed - all the while
maintaining a real sense of ownership at the process level.
The tools identified on the panel are explained
in some detail below:

|
The Communication Map, otherwise known as the 'Roof'
of the QFD is a tool which explores the likely points of synergy
or friction within the organisation (by mapping relationships),
and helps determine the necessary levels and forms of communication
to minimise conflict, and maximise cross-working and teamwork.
The method of developing the 'roof' (Communication Map) is explained
in some detail in Chapter 23
of Managing by Design, and in simple step form in Chapter
7 of How to Build a Better Business. It is also supported
by a slide deck (161 KB), which
is available on clicking the link above. |
|
|
The Relationship Mapping approach to understand
and explore communication needs is also supported by tools such
as the Interrelationship
Diagraph and the Process Decision
Program Chart (PDPC). The first can be used to understand
where communication already does take place, and the second to
understand what information is required to make a decision (and
therefore what communication needs to take place). While this
is not the conventional use for these tools, it is easy to adapt
them to look at decision making and communication. In theremore
usual form, they are still useful to understand how communication
can be used to ensure or avoid causality (depending whether it
is a project or a problem that is being reviewed in the interrelationship
diagraph) or to accelerate a project (as in the PDPC). |
|
|
Quadrant Chart Reporting is an extremely powerful
and efficient method of communicating confidence that progress
and performnce is in control (or of highlighting quickly the
fact that they are not). It is a tool that communicates execution
of process responsibilitiy back up to the top level of the organisation.
All of the salient information: KPIs, performance against forecast,
analysis of deviations, and planned corrective actions are reported
succinctly on one piece of paper which can be assimilated in
less than a minute. Chapter
24 of Managing by Design provides a detailed explanation
of the tool, and the following slide
deck can be used to assist in their explanation to others.
Finally, an Excel template
exists which can (with care) be adapted for use in preparing
Quadrant Charts. |
|
|
Metrics
Deployment Analysis (109 KB) is a simple tool to evaluate
the extent to which critical factors in ensuring success are
covered by effective measurement systems. Ideally, within QFD
based systematic management such a tool would be superfluous,
but we do not always start at the same place, and so the metrics
deployment analysis provides a useful insight into the coincidence
of responsibility and communication (or not) in organisations
that have not yet implemented qfd, cascade deployment and quadrant
charts |
|
|
IPS (Inter-Personal Skills) and Facilitator Training
represent the 20% of tools reflected on the Communication panel
that are not about gaining clarity of focus over 'what'
needs to be communicated, by 'whom' to 'whom'. But they are
neverthes less vitally important components of ensuring the other
80% runs smoothly. InterPersonal
Skills provide a basic skill set to ensure communication
is efficient and conclusive, and Facilitator
Training can help managers to adopt a role with their teams
which helps to build clear understanding and commitment. |
Pages 374-392 of Managing
by Design can be found in Chapter
23 and Chapter 24 which
can be read as pdf files (114 & 105 KB) by clicking the links
above.
Chapter 7 of How To Build
A Better Business can be read as a pdf file by clicking here.
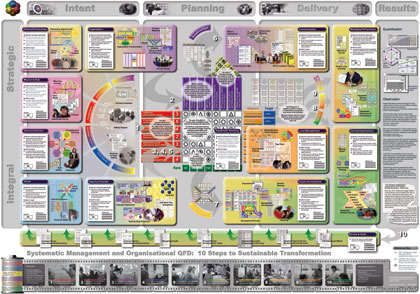
Blank templates of this panel can be found in the
Big Picture Storyboard
file - these can be used to capture your own experiences and
progress in this area (by annotating them either in PowerPoint,
or as a printed panel), and then to physically cut and paste
them onto the Big Picture to create your own storyboard of implementing
systematic management in your organisation.
To explore another secion of
the big picture, please click on the relevant area of the image
below:
Home - Load frames - About
us - Resources - Contact
us
© Tesseract
Management Systems Ltd 2006
|
 |
Fast Perspectives:
(click below for an oversight)
Get your own Big Picture
(Purchase the Big Picture as a high
quality wall chart)
The best systematic
resources now available.
(tools and methodologies)
Testimonials on systematic management
|